

Introduction
Operational risk is an important component of enterprise risk management. Organizations are exposed to risks arising from people, processes, systems, technology, third parties, and external events. Identifying these risks is only the first step. Organizations also need the ability to continuously monitor changes in their risk exposure.
This is where Key Risk Indicators (KRIs) play an important role.
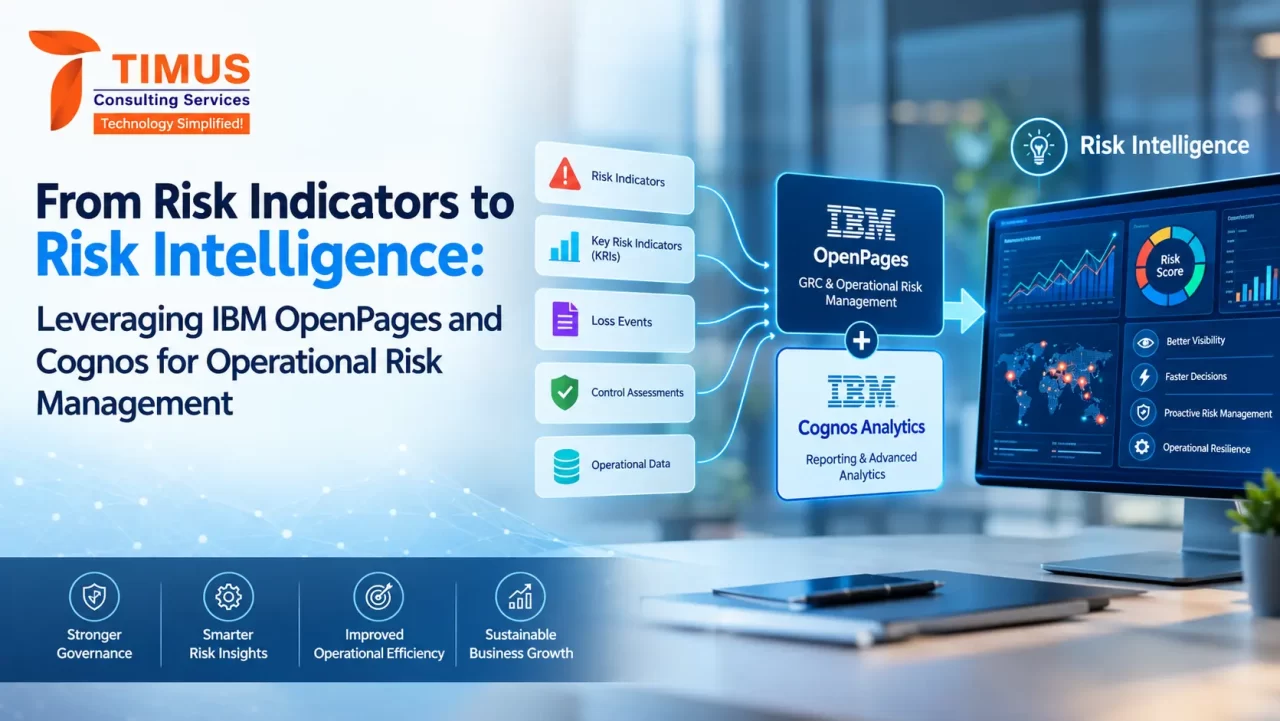
KRIs are measurable indicators that provide an early signal of potential changes in risk exposure. When KRIs are integrated with a GRC platform such as IBM OpenPages and supported by IBM Cognos Analytics for reporting and visualization, organizations can establish a structured approach to monitoring operational risk.
This combination allows organizations to move beyond periodic risk assessments and develop a more continuous approach to risk monitoring.
What Are Key Risk Indicators?
A Key Risk Indicator is a measurable metric used to provide an indication of an organization’s exposure to a particular risk.
KRIs are different from Key Performance Indicators (KPIs). KPIs generally focus on business performance, while KRIs focus on potential changes in risk exposure.
For example, an organization may monitor system availability as a KPI, while the number of critical system outages could be used as a KRI.
Some examples include:
| Risk Area | Example KRI |
|---|---|
| IT Operations | Number of critical system outages |
| Cybersecurity | Number of high-severity vulnerabilities |
| Third-Party Risk | Number of critical vendor SLA breaches |
| Operations | Number of processing errors |
| Compliance | Number of overdue regulatory actions |
| Finance | Number of failed or rejected transactions |
The purpose of a KRI is not simply to collect another metric. It should provide useful information that helps risk managers identify changes in risk conditions.
Why KRIs Matter in Operational Risk Management
Operational risk can change quickly.
For example, an organization may normally experience a small number of processing errors each month. If those errors begin increasing consistently, it could indicate a problem with a business process, system, employee capacity, training, data quality, or a third-party service.
Without appropriate monitoring, the organization may only identify the problem after it develops into a significant incident.
A well-designed KRI can provide an earlier warning.
For example, an organization may define the number of critical system outages as a KRI and establish a threshold of five outages per month. If the number increases beyond that threshold, the risk owner can investigate the underlying cause and determine whether additional action is required.
Designing an Effective KRI
A KRI should have clearly defined attributes so that it can be consistently measured, interpreted, and reported.
Typical KRI information can include:
- KRI name
- KRI description
- Related risk
- Risk category
- Business entity
- KRI owner
- Measurement frequency
- Data source
- Measurement unit
- Target value
- Threshold values
- Current value
- Status
- Reporting period
- Review date
For example:
KRI: Critical System Outages
Related Risk: Technology failure may disrupt critical business operations.
Measurement: Number of critical system outages per month
Green: 0–2
Amber: 3–5
Red: More than 5
Frequency: Monthly
Owner: IT Risk Manager
This provides context around the metric and makes the KRI meaningful from a risk management perspective.
KRI Thresholds and Risk Appetite
Thresholds are a critical component of KRI management.
Organizations can define different levels of tolerance to indicate whether a risk requires normal monitoring, increased attention, or escalation.
| Status | Interpretation | Potential Action |
|---|---|---|
| Green | Within acceptable range | Continue monitoring |
| Amber | Increased risk exposure | Review and monitor |
| Red | Threshold exceeded | Escalate and assess action |
Thresholds should ideally be aligned with the organization’s risk appetite and tolerance framework.
Historical data can also be used to establish realistic thresholds. Regulatory requirements, business criticality, and previous incidents can provide additional context.
A KRI should therefore not be viewed simply as a number. The value becomes meaningful when it is evaluated against an established tolerance.
KRIs and the GRC Framework
KRIs are most effective when they are integrated with the broader GRC framework.
Instead of managing KRIs as standalone metrics, organizations can establish relationships between:
- Risks
- KRIs
- Controls
- Assessments
- Issues
- Remediation actions
For example, an organization may identify a technology risk related to system availability. A KRI measuring critical system outages can then be associated with that risk.
If the KRI exceeds its defined threshold, the risk owner can review the situation and determine whether additional controls, remediation activities, or a risk reassessment are required.
This creates a stronger connection between risk identification and risk monitoring.
Managing KRIs in IBM OpenPages
IBM OpenPages can be used to incorporate KRI management into an organization’s existing GRC framework.
The exact implementation will depend on the organization’s OpenPages data model and configuration. However, KRI information can be structured to capture attributes such as:
- KRI name
- Description
- Related risk
- Business entity
- Owner
- Measurement frequency
- Threshold values
- Current measurement
- Status
- Reporting period
KRIs can be related to the relevant Risk records, allowing users to understand which indicators are being used to monitor specific risks.
This relationship is important because it provides context around the KRI. A risk manager can move from a KRI result to the underlying risk and review associated controls, assessments, or issues.
KRI Data Collection
One of the challenges associated with KRI management is obtaining reliable data.
KRI information may originate from a variety of systems, including:
- IT service management platforms
- Cybersecurity systems
- Finance applications
- HR systems
- Vendor management platforms
- Business applications
- Regulatory systems
- Manual assessments
Organizations can use appropriate integration or data-loading mechanisms to bring relevant information into their GRC environment.
For example, operational data can be collected from source systems and made available in OpenPages for risk management and monitoring.
This reduces the need for risk teams to manually consolidate information from multiple sources.
KRI Assessments in OpenPages
KRI monitoring can also be incorporated into periodic risk assessment processes.
For example, a monthly operational risk review could include the following information:
| KRI | Current Value | Threshold | Status |
|---|---|---|---|
| Critical System Outages | 3 | 5 | Amber |
| Processing Errors | 12 | 20 | Green |
| Vendor SLA Breaches | 8 | 5 | Red |
| Failed Transactions | 2.1% | 3% | Green |
The risk owner can review the results and determine whether additional investigation or action is required.
Where appropriate, a threshold breach can lead to an issue, remediation action, or additional risk assessment.
Workflow Automation for KRI Management
Workflow automation can make KRI management more proactive.
For example, an organization can configure a process where a KRI exceeding a defined threshold results in a review task being assigned to the relevant risk owner.
Depending on the organization’s requirements, the process could include:
- Notification to the risk owner
- Review of the KRI result
- Risk reassessment
- Control review
- Issue creation
- Remediation tracking
- Management escalation
This approach helps ensure that a KRI breach does not simply appear on a report and remain unresolved.
Instead, the breach can become part of an established risk management process.
Reporting KRIs Using IBM Cognos
While OpenPages can provide the GRC data and risk management framework, IBM Cognos Analytics can be used to provide reporting and visualization capabilities.
Cognos dashboards can bring together KRI information with other GRC information to provide a broader view of operational risk.
A KRI dashboard could include:
KRI Status
A summary of KRIs categorized by Green, Amber, and Red status.
KRI Trends
Historical trends showing whether individual KRIs are improving or deteriorating over time.
Risk Category
KRI results grouped by areas such as:
- Operational Risk
- IT Risk
- Cyber Risk
- Third-Party Risk
- Compliance Risk
Business Entity
KRI performance across different business units or organizational entities.
Threshold Breaches
A list of KRIs that have exceeded their defined tolerance.
Risk Owner
A view of KRIs requiring attention from specific risk owners.
Using Cognos for KRI Trend Analysis
A single KRI value provides only a snapshot of risk exposure.
Trend analysis provides additional context.
For example, suppose the number of operational processing errors remains below the Red threshold but increases consistently over six months.
The organization may want to investigate this trend even though the KRI has not technically breached its threshold.
Cognos can be used to present historical KRI values and help users identify:
- Increasing risk exposure
- Decreasing risk exposure
- Repeated threshold breaches
- Seasonal patterns
- Significant changes between reporting periods
This allows risk teams to look beyond individual reporting periods and understand how risk exposure is changing.
Drill-Down Reporting
Another useful capability of Cognos reporting is the ability to provide different levels of detail.
A risk manager may begin with a high-level view of KRI status and then investigate the underlying information.
For example, a report could allow users to review:
- Overall KRI status
- Business unit
- Risk category
- Individual risk
- KRI
- KRI measurement
- Associated issue
- Remediation action
This type of reporting can help answer questions such as:
Why has this KRI become Red?
Which risk does it relate to?
Who owns the risk?
Are there associated control weaknesses?
Is there an open issue?
What remediation action is being taken?
This turns reporting from a static presentation of numbers into a tool for risk analysis.
Common Operational Risk KRIs
The KRIs selected by an organization will depend on its risk profile and business processes. Some commonly monitored areas include:
Technology Risk
- Critical system outages
- Application failures
- Failed technology changes
- Service availability
- Critical incidents
Cybersecurity Risk
- High-severity vulnerabilities
- Security incidents
- Failed authentication attempts
- Patch compliance
- Data security incidents
Operational Risk
- Processing errors
- Failed transactions
- Operational incidents
- Backlog volumes
- Manual processing exceptions
Third-Party Risk
- Vendor SLA breaches
- Critical vendor incidents
- Service interruptions
- Overdue vendor assessments
- Vendor-related operational incidents
Compliance Risk
- Overdue regulatory actions
- Compliance breaches
- Failed control tests
- Overdue compliance assessments
The important consideration is that each KRI should have a clear relationship with the risk it is intended to monitor.
KRI Management Challenges
Too Many KRIs
Organizations can sometimes create a large number of indicators without determining whether they provide meaningful risk insight.
A smaller number of relevant and well-defined KRIs can be more effective than a large collection of unrelated metrics.
Poor Data Quality
If the underlying data is inaccurate, incomplete, or outdated, the KRI may provide a misleading view of risk exposure.
Data quality should therefore be considered as part of the KRI design process.
Undefined Thresholds
A KRI without clearly defined thresholds may provide information but may not provide a clear indication of when action is required.
Lack of Ownership
Each KRI should have an identified owner who is responsible for reviewing the results and responding to significant changes.
Lack of Connection to Risk
A metric should not automatically become a KRI simply because it is easy to measure.
There should be a clear explanation of how the metric provides insight into a specific risk.
Reporting Without Action
A dashboard showing a Red KRI is only useful if there is a defined process for investigating and responding to the breach.
Best Practices for KRI Design
1. Start with the Risk
First understand the risk that needs to be monitored and then identify the metric that can provide an early indication of changing exposure.
2. Define Clear Thresholds
Establish meaningful Green, Amber, and Red ranges based on risk appetite, tolerance, historical information, and business requirements.
3. Assign Ownership
Every KRI should have a clearly defined owner.
4. Establish Measurement Frequency
Determine whether the KRI should be measured daily, weekly, monthly, quarterly, or annually.
5. Identify the Data Source
Document where the KRI data originates and establish appropriate data quality checks.
6. Avoid Redundant Metrics
KRIs should provide distinct and useful risk information rather than duplicate existing indicators.
7. Connect KRIs to Risks
The relationship between the KRI and the underlying risk should be clearly documented.
8. Automate Where Possible
Automation can reduce manual data collection and improve the timeliness of monitoring.
9. Monitor Trends
Risk teams should consider changes over time rather than focusing only on the current reporting period.
10. Connect Reporting to Action
A threshold breach should lead to an appropriate review, escalation, or remediation process where required.
The Role of OpenPages and Cognos in KRI Management
An effective KRI framework benefits from combining GRC management capabilities with reporting and analytics.
OpenPages can provide the structure for managing risks, controls, KRIs, assessments, issues, owners, and workflows.
Cognos can provide the reporting layer required to analyze and present this information through dashboards, trends, summaries, and detailed reports.
Together, they can support a more connected approach to operational risk management.
The objective is not simply to create another dashboard. The objective is to establish a repeatable process in which risk indicators provide meaningful information, threshold breaches receive appropriate attention, and risk information is available to the right stakeholders.
Conclusion
Key Risk Indicators are an important component of modern operational risk management. However, their effectiveness depends on how well they are designed, maintained, monitored, and integrated with the broader GRC framework.
Using IBM OpenPages, organizations can incorporate KRIs into their existing risk, control, assessment, issue, and workflow processes. IBM Cognos Analytics can then provide the reporting and analytical capabilities needed to understand KRI trends and identify areas requiring attention.
The combination of OpenPages and Cognos can help organizations move from periodic risk reporting toward a more continuous approach to operational risk monitoring.
A well-designed KRI framework ultimately answers three important questions:
What risks are changing?
Where is risk exposure increasing?
What action is required?
When KRIs are connected to risks, controls, workflows, and reporting, they become more than simple metrics. They become an important part of an organization’s ongoing risk monitoring and decision-support process.